

Quick answer: A real estate photo editing turnaround benchmark should measure whether an editor delivers the agreed work on time and at an acceptable first-pass quality. Track the promised service window, on-time delivery rate, first-pass approval rate, revision rate, revision response time, and order complexity. Do not compare a basic enhancement order with virtual staging or advanced retouching as though they require the same production process.
This page is a measurement guide for photographers and real estate media companies. It complements our real estate photo editing turnaround guide, which explains what affects delivery time. Here, the focus is how to score performance, compare providers, and set a service-level agreement that both sides can measure.
Important: The scoring model and examples below are PixelShouters planning tools, not audited industry standards. Use your own order history, service mix, cutoff times, and client deadlines to set the targets that matter to your business.
Table of Contents
- What the benchmark measures
- Define the turnaround clock
- Turnaround KPIs
- Benchmark score and example
- Complexity tiers
- Capacity and batching
- Provider comparison
- SLA template
- Frequently asked questions
What a Real Estate Photo Editing Turnaround Benchmark Measures
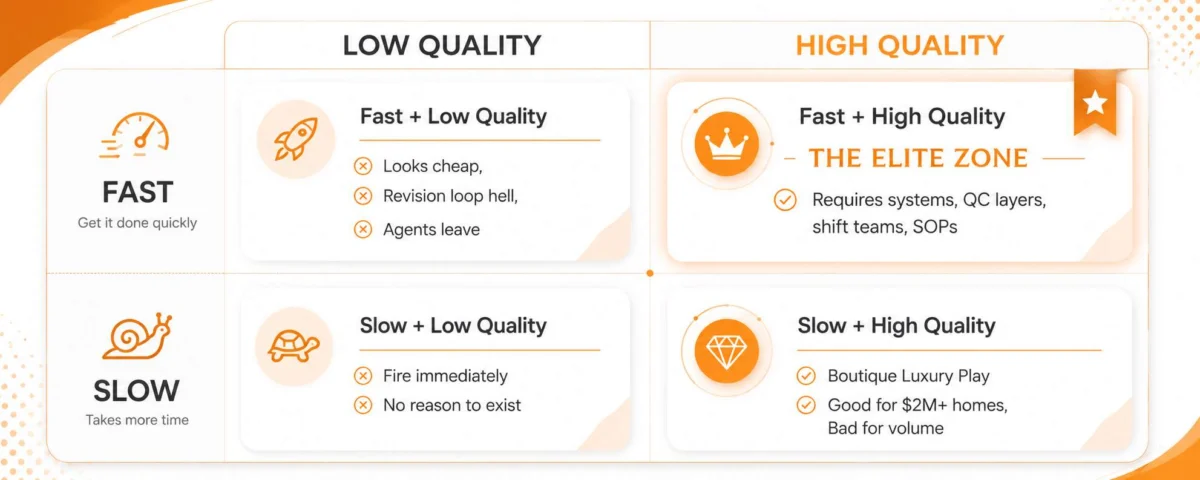
A useful benchmark answers a narrower question than “How fast is the editor?” It asks: How reliably does this workflow return approved work within the promised window?
That distinction matters because an early delivery that needs repeated corrections may be slower in practice than a slightly longer service window with a high first-pass approval rate. The benchmark should cover the full order cycle:
- Files finish uploading.
- The provider confirms file count, services, instructions, and due time.
- Editing and internal quality control occur.
- The first delivery is available.
- The client checks the gallery.
- Any valid revisions are completed.
- The gallery is approved for client delivery.
Record both first delivery time and effective turnaround. Effective turnaround ends when the gallery is approved, so it reveals the time added by avoidable revision loops.
Define the Turnaround Clock Before Comparing Providers
Two companies can advertise “24-hour turnaround” while measuring different windows. Put the following rules in writing:
| Clock rule | What to define | Why it matters |
|---|---|---|
| Start | Upload complete and order accepted | Separates client upload time from production time |
| Cutoff | Time zone and daily submission cutoff | Prevents overnight promises from being interpreted differently |
| Pause conditions | Missing files, unclear notes, or client approval holds | Keeps the metric fair and auditable |
| First delivery | Complete downloadable gallery, not a partial notification | Defines the first measurable outcome |
| Final approval | All valid revisions delivered | Measures effective turnaround |
For mixed orders, separate services with different production windows. A standard enhancement batch should not be delayed because two images also need virtual staging or extensive object removal.
Six KPIs for Editing Turnaround Performance
1. On-time delivery rate
Orders delivered by the agreed first-delivery deadline / completed orders x 100. Use the deadline recorded when the provider accepted the order.
2. First-pass approval rate
Images approved without a valid editing revision / delivered images x 100. Exclude client preference changes that were not present in the original brief.
3. Order revision rate
Orders requiring at least one valid editing revision / completed orders x 100. This shows how often a delivery returns to production.
4. Revision response time
Measure from confirmed revision request to corrected delivery. Report the median and the 90th percentile; an average can hide occasional long delays.
5. Effective turnaround
Final approval time – accepted order time. This is the most useful client-facing measure because it includes revision impact.
6. Rush success rate
Rush orders completed by the rush deadline / accepted rush orders x 100. Keep rush performance separate from standard service data.
PixelShouters Turnaround Benchmark Score
The following weighted score is an internal comparison model. Adjust the weights when another factor matters more to your clients.
Benchmark score = (On-time delivery x 35%) + (First-pass approval x 30%) + (Revision response score x 15%) + (Communication score x 10%) + (Rush success x 10%).
Every component must use a 0-100 scale. Define the revision and communication scoring rules before reviewing results so the score cannot be changed to favor a provider.
Illustrative calculation
Suppose a provider records 94 for on-time delivery, 96 for first-pass approval, 80 for revision response, 90 for communication, and 85 for rush success. The score is:
(94 x 0.35) + (96 x 0.30) + (80 x 0.15) + (90 x 0.10) + (85 x 0.10) = 91.2.
This example demonstrates the formula only. It is not a claim about typical provider performance.
| Score band | Internal interpretation | Next action |
|---|---|---|
| 90-100 | Strong reliability under the chosen rules | Monitor by complexity and volume |
| 75-89 | Generally dependable with visible gaps | Review the weakest component |
| 60-74 | Material delivery or quality risk | Correct the process and retest |
| Below 60 | Unreliable under the chosen service promise | Use a backup plan before increasing volume |
Benchmark Turnaround by Editing Complexity
Do not publish one blended score for unlike services. Group orders by a complexity tier, then measure each tier against its own promised SLA.
| Tier | Typical work | Main risk | Measure separately |
|---|---|---|---|
| Routine | Exposure, color, lens and vertical correction | Batch inconsistency | First-pass approval |
| Blended | HDR, flambient, window masking | Halos, color casts, window balance | Quality and revision time |
| Advanced | Object removal, reflections, decluttering, twilight | Scope changes and manual masking | Complexity-adjusted SLA |
| Design-led | Virtual staging and virtual renovation | Design approval and multi-angle consistency | Concept and revision cycles |
For a deeper explanation of service-specific delivery factors, see the turnaround timeline guide. Teams processing large sets should also review bulk property photo editing.
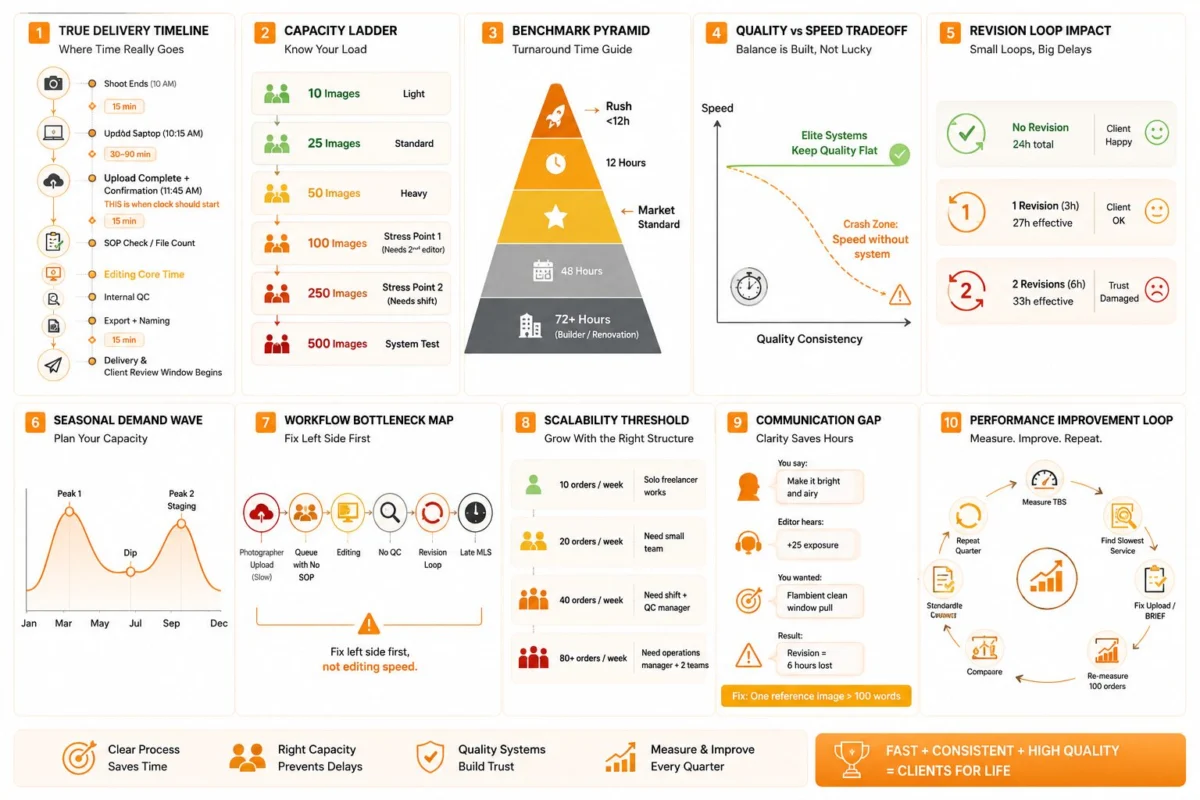
Test Capacity Without Inventing an Industry Average
Capacity is provider-specific. A solo editor, a shift-based team, and an automated platform should not be assigned the same volume limit. Ask each provider for a documented answer to these questions:
- How many routine images can be accepted before the standard SLA changes?
- How are complex services routed and quality checked?
- What happens when an editor is absent or a queue exceeds forecast?
- Can a large order be delivered in approved batches?
- Does rush work reduce capacity available to standard orders?
- Which order conditions must be confirmed before the clock starts?
For a large or mixed order, agree on batch names and due times before upload. A staged delivery can move routine images into the listing workflow while advanced edits continue under a separate deadline.
How to Compare Photo Editing Providers
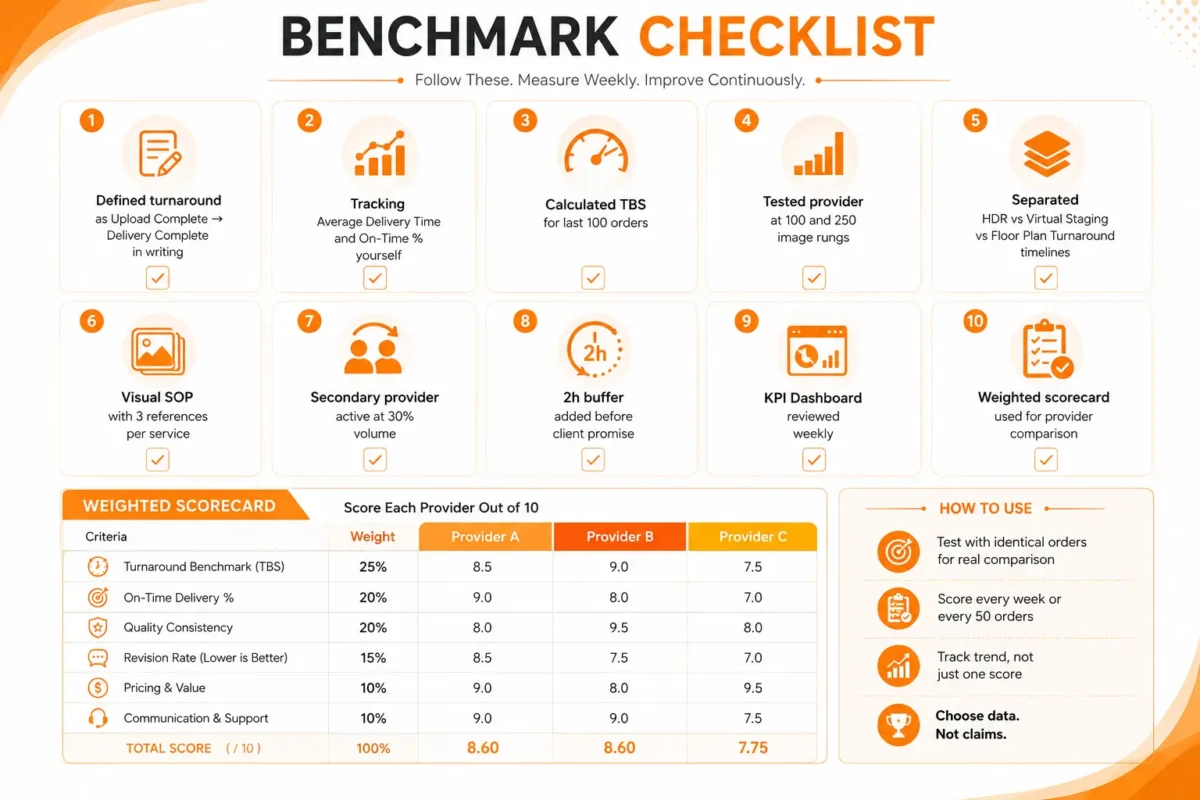
Run a matched test instead of comparing marketing pages. Give each provider a similar set of source files, the same written brief, the same reference finish, and the same delivery requirement.
| Test item | Record | Avoid |
|---|---|---|
| Order confirmation | File count, services, due time | Unconfirmed assumptions |
| First delivery | Timestamp and completeness | Counting partial files as complete |
| Quality | Pass/fail against written criteria | Changing preferences after delivery |
| Revision | Reason, response time, outcome | Mixing provider errors with new requests |
| Management time | Minutes spent briefing and checking | Ignoring your own operating cost |
For a broader production-model comparison, read real estate photo editing software vs. service. If you are testing an outsourced workflow, the PixelShouters editing service explains the available production categories.
A Simple Editing Turnaround SLA Template
Use a short service-level agreement for each service tier:
- Order accepted when: upload is complete and the provider confirms file count, service, and instructions.
- Standard deadline: the exact date, time, and time zone recorded at acceptance.
- Cutoff rule: submissions after the daily cutoff move to the next production window.
- Pause rule: the clock pauses only for documented missing information or source files.
- First-delivery requirement: all agreed files are downloadable and named correctly.
- Revision distinction: provider correction versus new client request.
- Revision deadline: confirmed when the correction request is accepted.
- Escalation: named contact and response path when a deadline is at risk.
Real Estate Photo Editing Turnaround Benchmark FAQs
What is a good turnaround time for real estate photo editing?
A good turnaround is one the provider can meet consistently for the agreed service and order size. Compare on-time delivery and first-pass approval under a written SLA rather than relying on a universal hour claim.
When should the editing clock start?
Start when the upload is complete and the provider has accepted the file count, service scope, instructions, and due time.
Should revisions count toward turnaround?
Track first delivery and final approval separately. Provider corrections should count toward effective turnaround; new client requests should be recorded as a scope change.
How many orders are needed for a useful benchmark?
Use enough completed orders to represent normal volume and service mix. Thirty orders can provide an initial view; larger samples and rolling 90-day reporting are more stable. Label a small sample as preliminary.
Should median or average turnaround be reported?
Report the median and the 90th percentile. The median describes a typical order, while the 90th percentile exposes slower cases that an average can hide.
How should mixed-service orders be measured?
Split routine and complex services into separate batches or agree that the entire order follows the longest service window. Record the rule before production starts.
What is more important: speed or first-pass quality?
Measure both. Fast first delivery with repeated corrections may produce a longer effective turnaround than a carefully reviewed delivery.
How often should the benchmark be reviewed?
Review monthly for operations and quarterly for provider decisions. Segment results when service mix, staffing, or order volume changes materially.
Final Recommendation
A defensible real estate photo editing turnaround benchmark is built from accepted deadlines, matched service categories, first-pass quality, and revision-adjusted delivery. It does not depend on an unsupported claim that every order should take the same number of hours.
Define the clock, measure the KPIs, test capacity with representative orders, and keep a backup path before promising the same deadline to your clients.